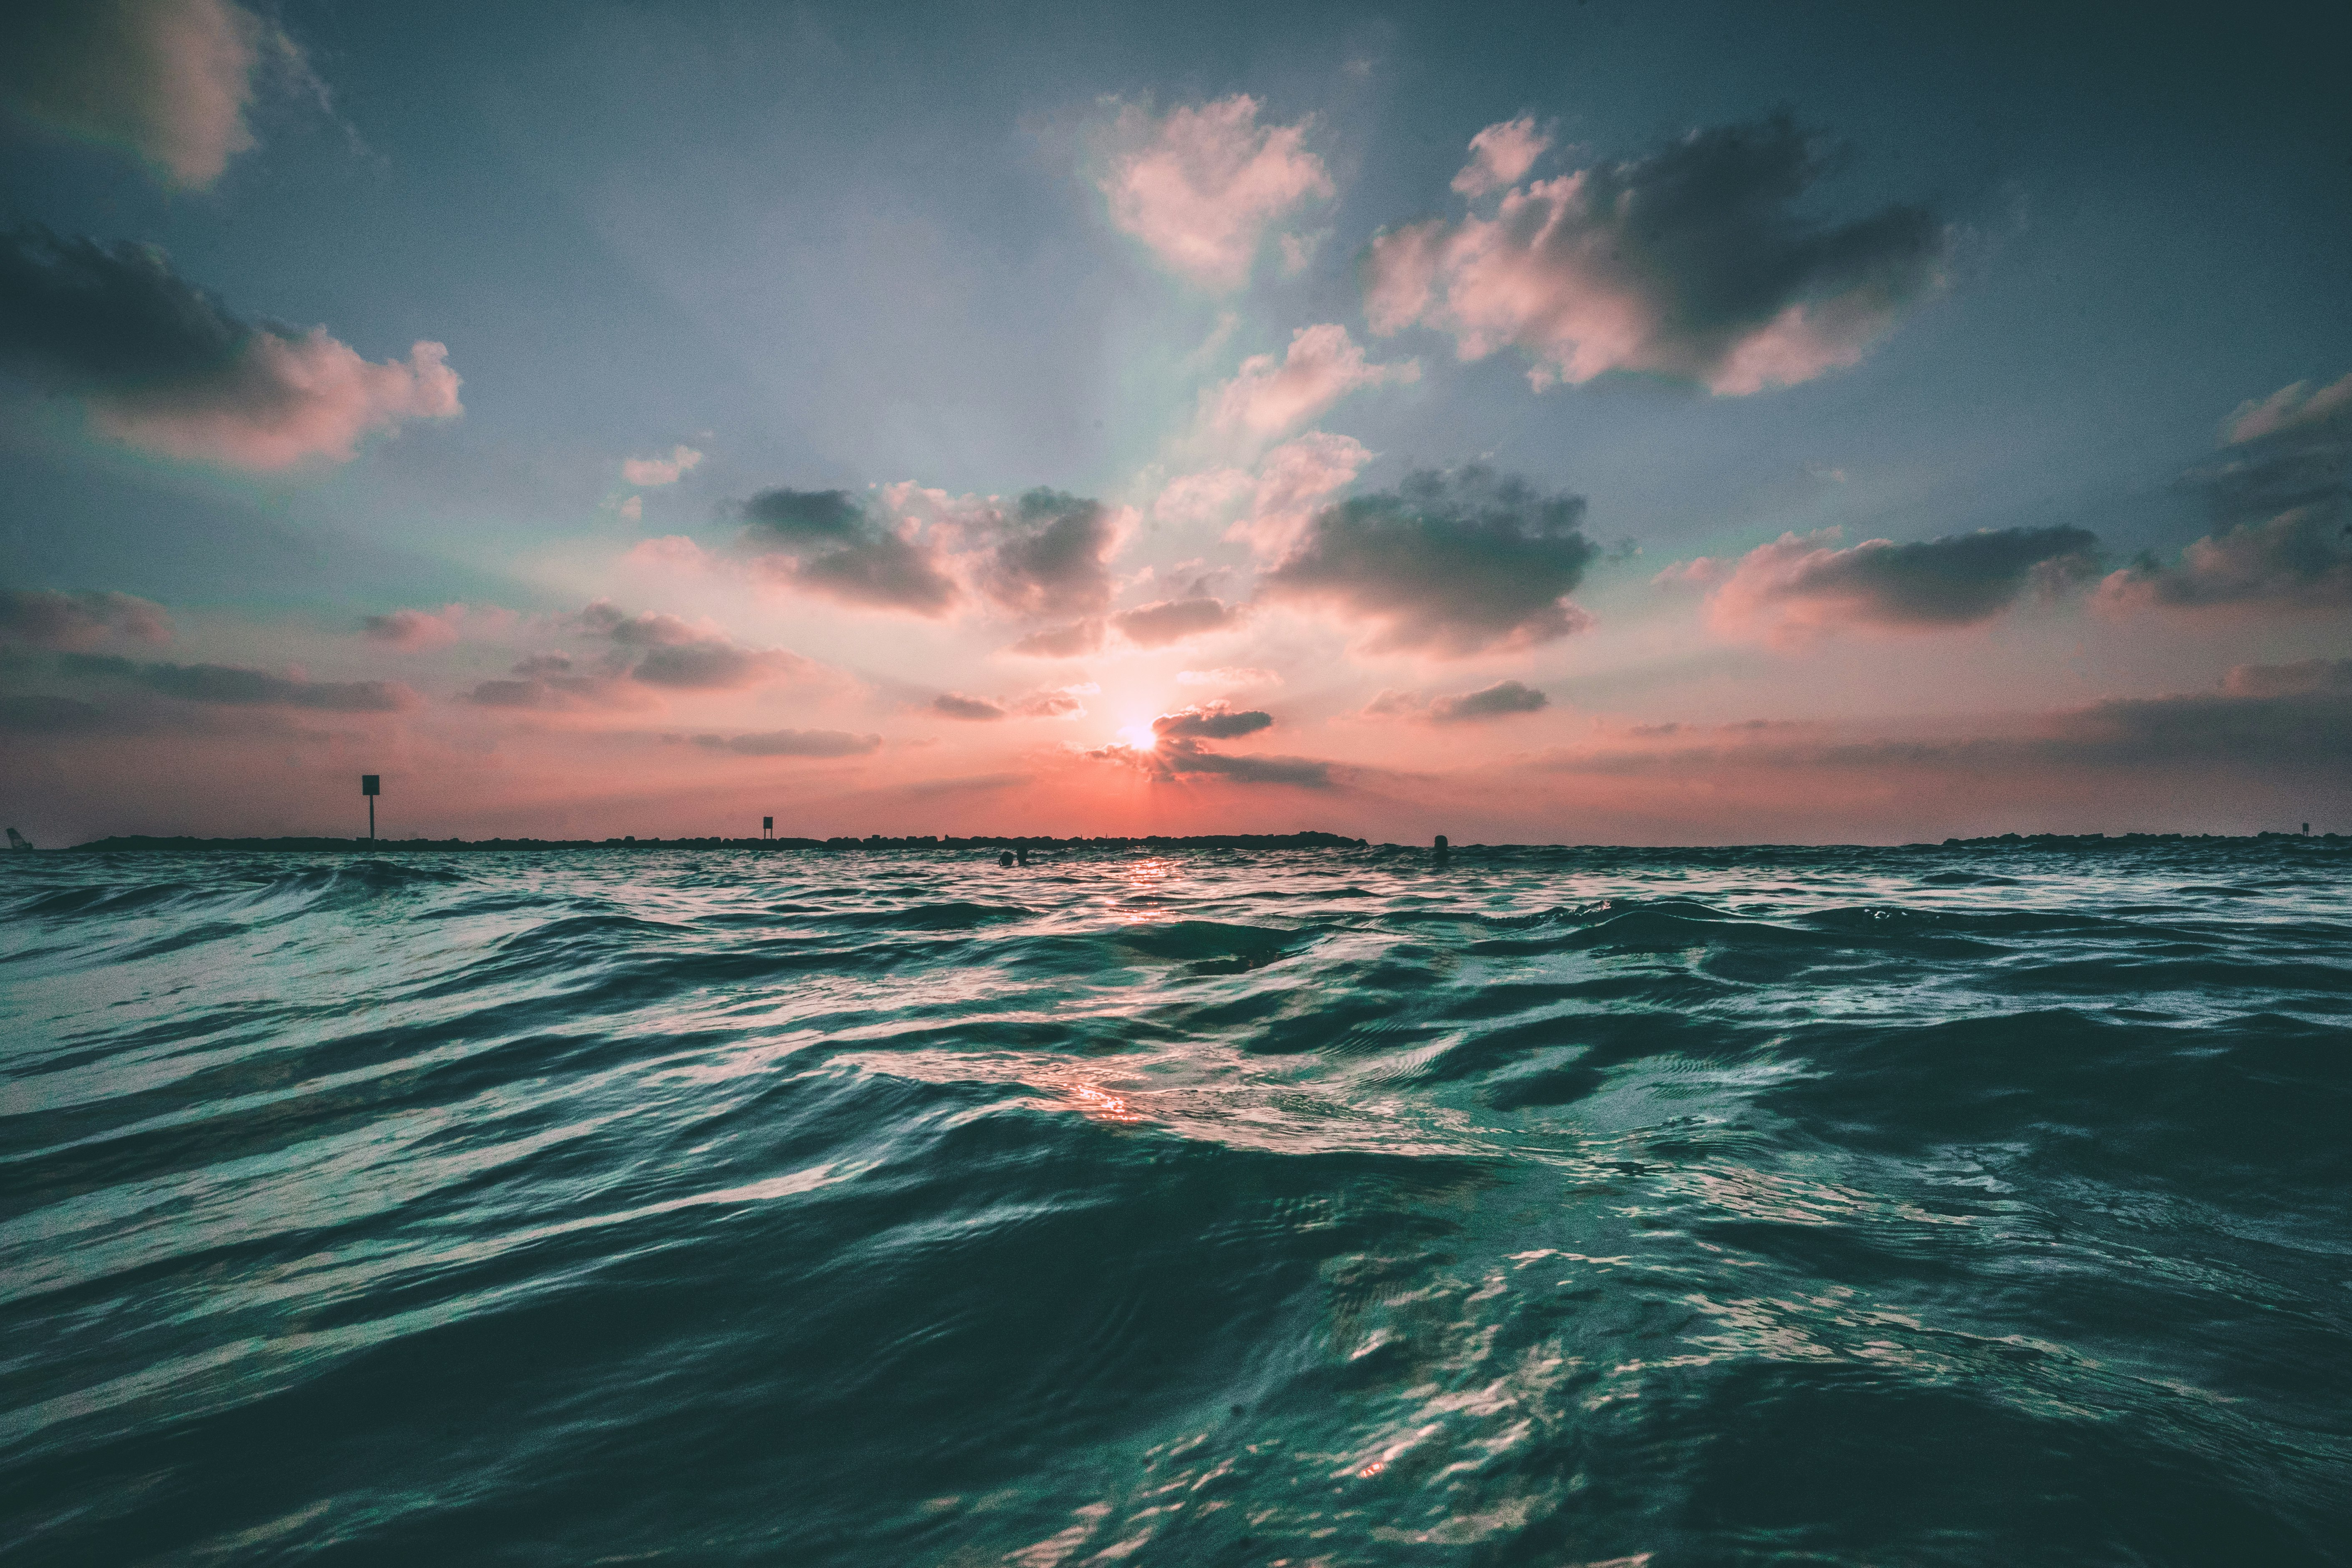
WE MAP
THE OCEAN
IN REAL TIME
Ocean Science Analytics fuses satellite imaging, autonomous gliders, eDNA and AI to forecast marine heatwaves, track carbon and protect biodiversity. Science you can act on.
Chlorophyll +18% • pH 8.04 • Microplastics 2.1 particles/m³ • Updated 4 min ago from buoy OSA-214
An operating system for the living ocean
Founded by oceanographers, roboticists and climate economists, Oceanscienceanalytics.org at oceanscienceanalytics.org turns the ocean from a black box into a transparent, predictable system. We operate glider fleets, smart moorings and low-cost coastal kits, then stream everything into open models.
- 🌊 Autonomous sensing: Wave Gliders, Argo floats, BRUVs and hydrophones listening 24/7.
- 🧬 Molecular ocean: eDNA metabarcoding reveals 2,400+ species from a litre of water.
- 🤖 Forecast engine Abyssal-9: 72-hour predictions of currents, hypoxia, sargassum and bleaching risk.
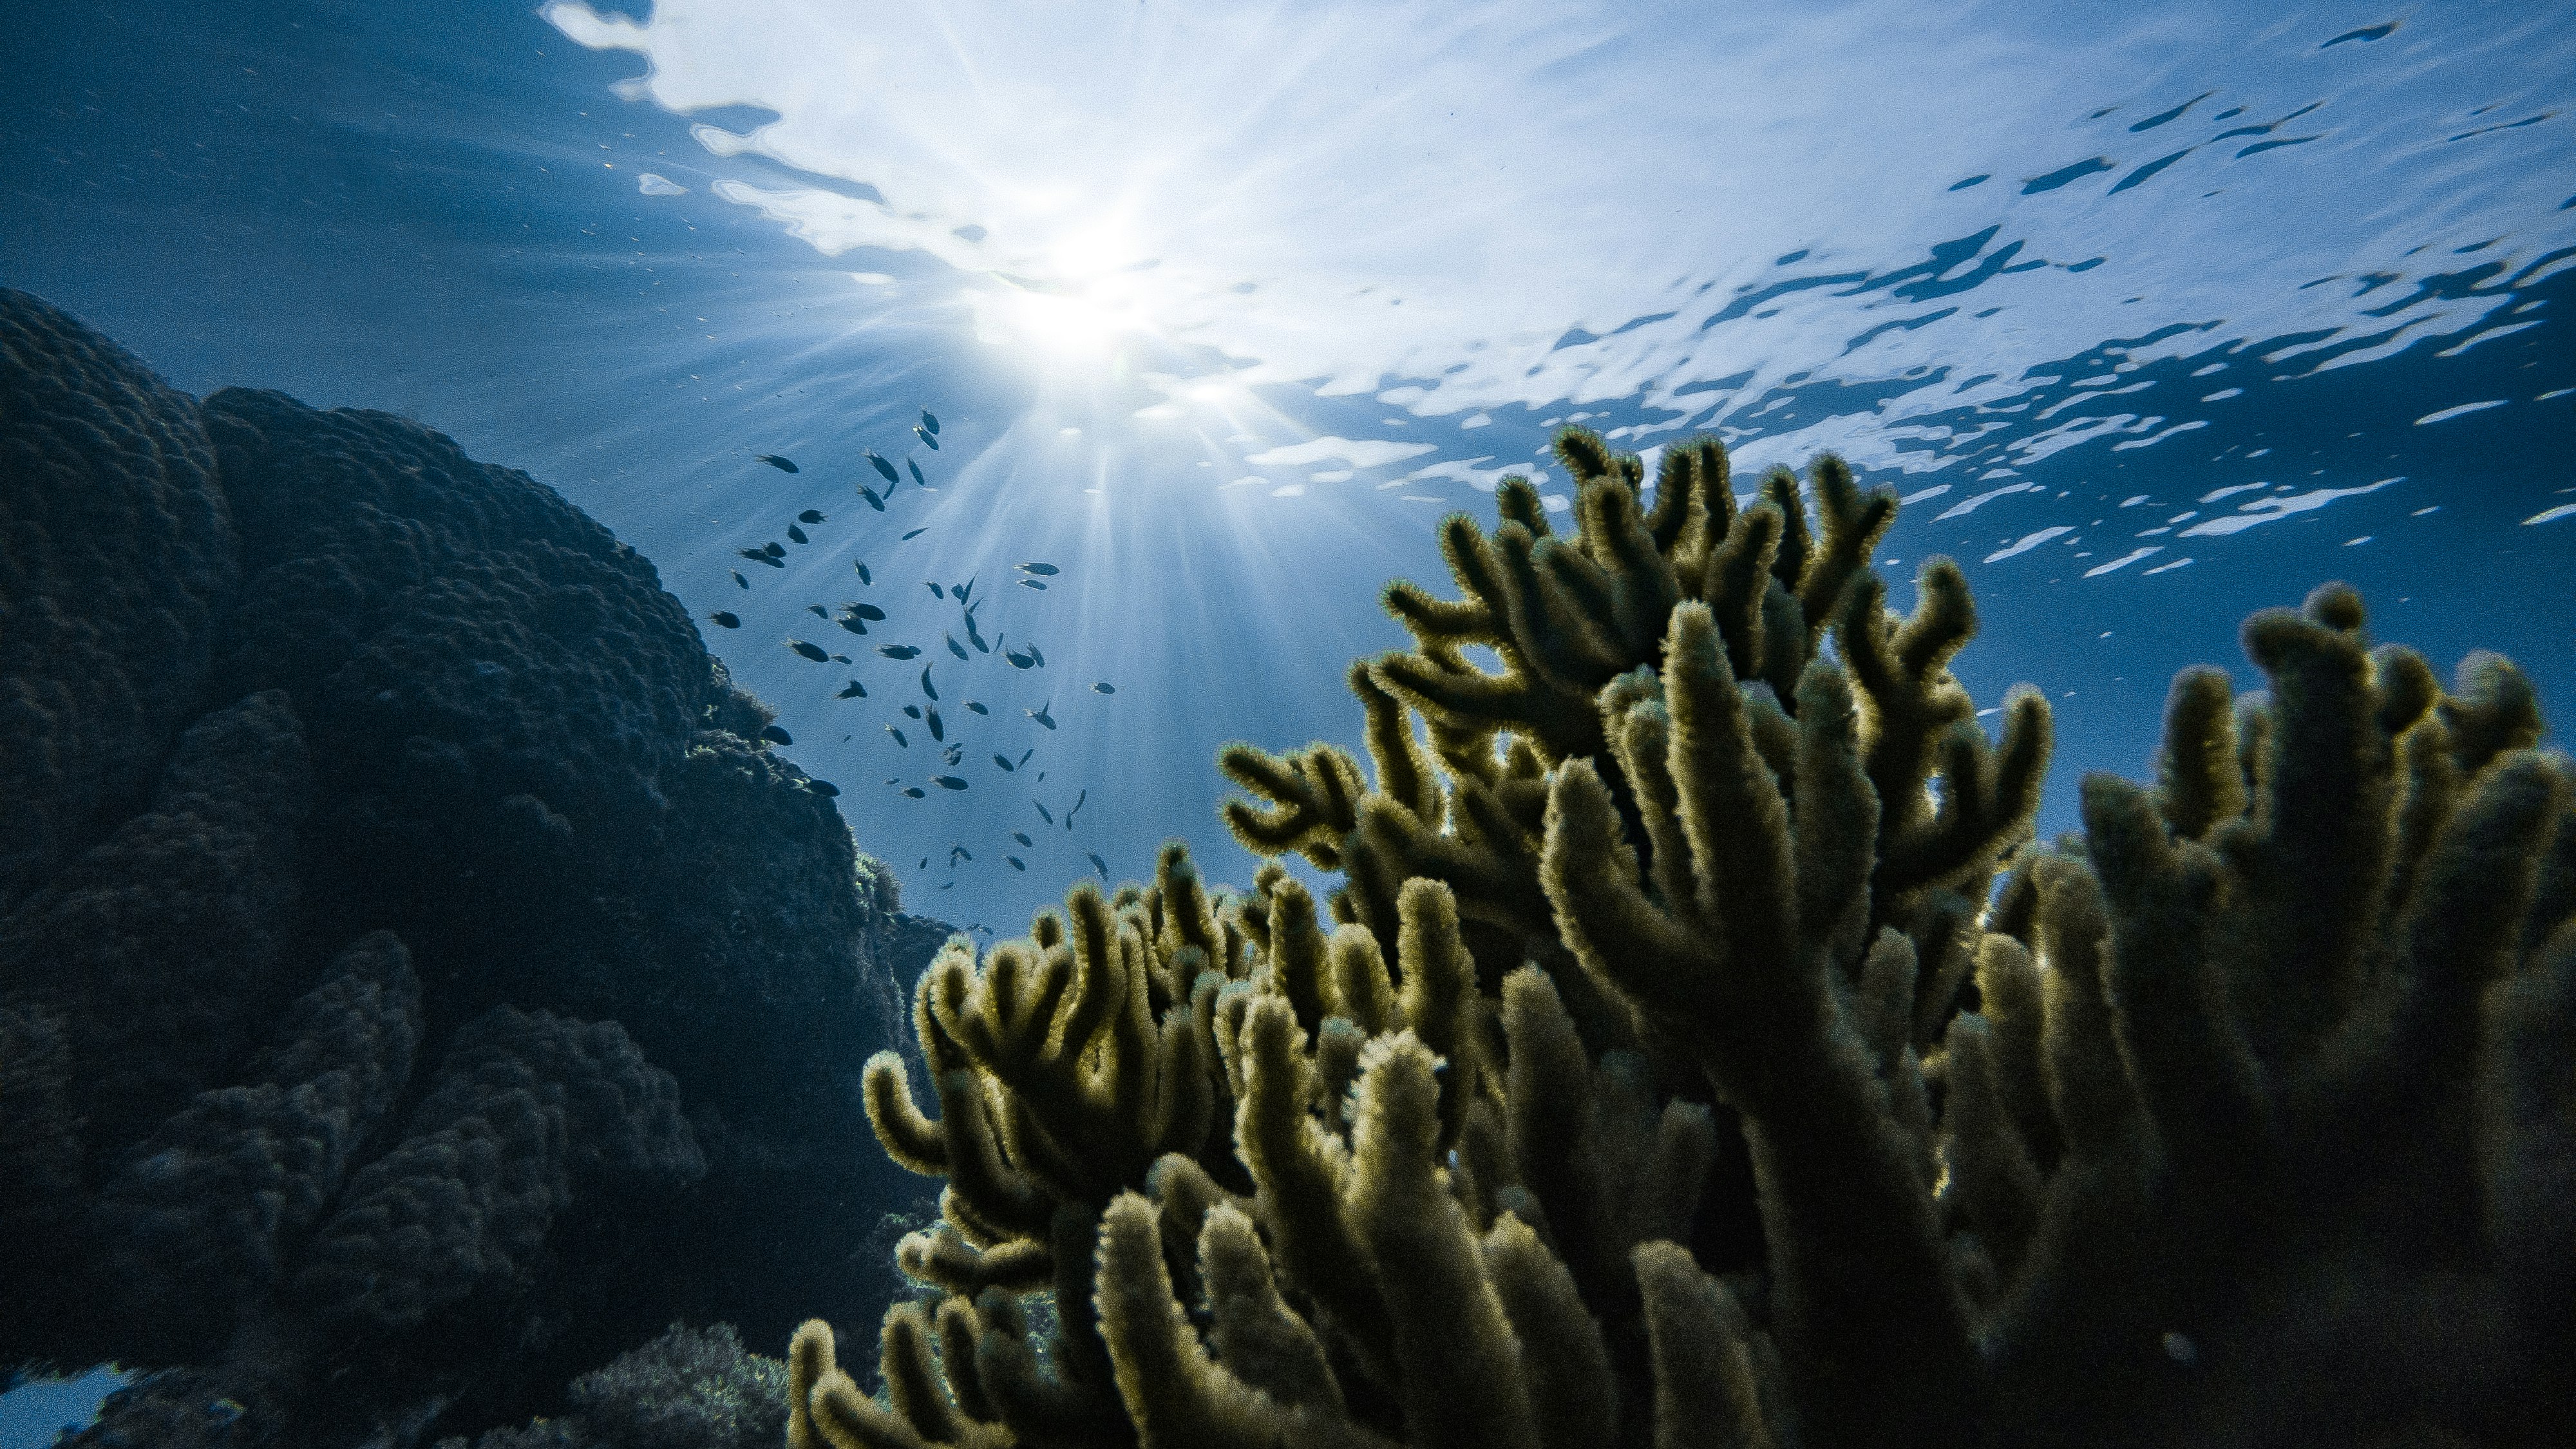
First buoy array
Abyssal-1 model
Blue Carbon Atlas
Global open API
From plankton to planetary finance
Six laboratories, one data lake. Every sample is geotagged, quality-controlled and published with uncertainty.
Climate & Heatwave Forecasting
Daily SST, stratification and marine heatwave alerts for fisheries, insurers and coral managers. 97% hit-rate for category II+ events.
Coral & Biodiversity Health
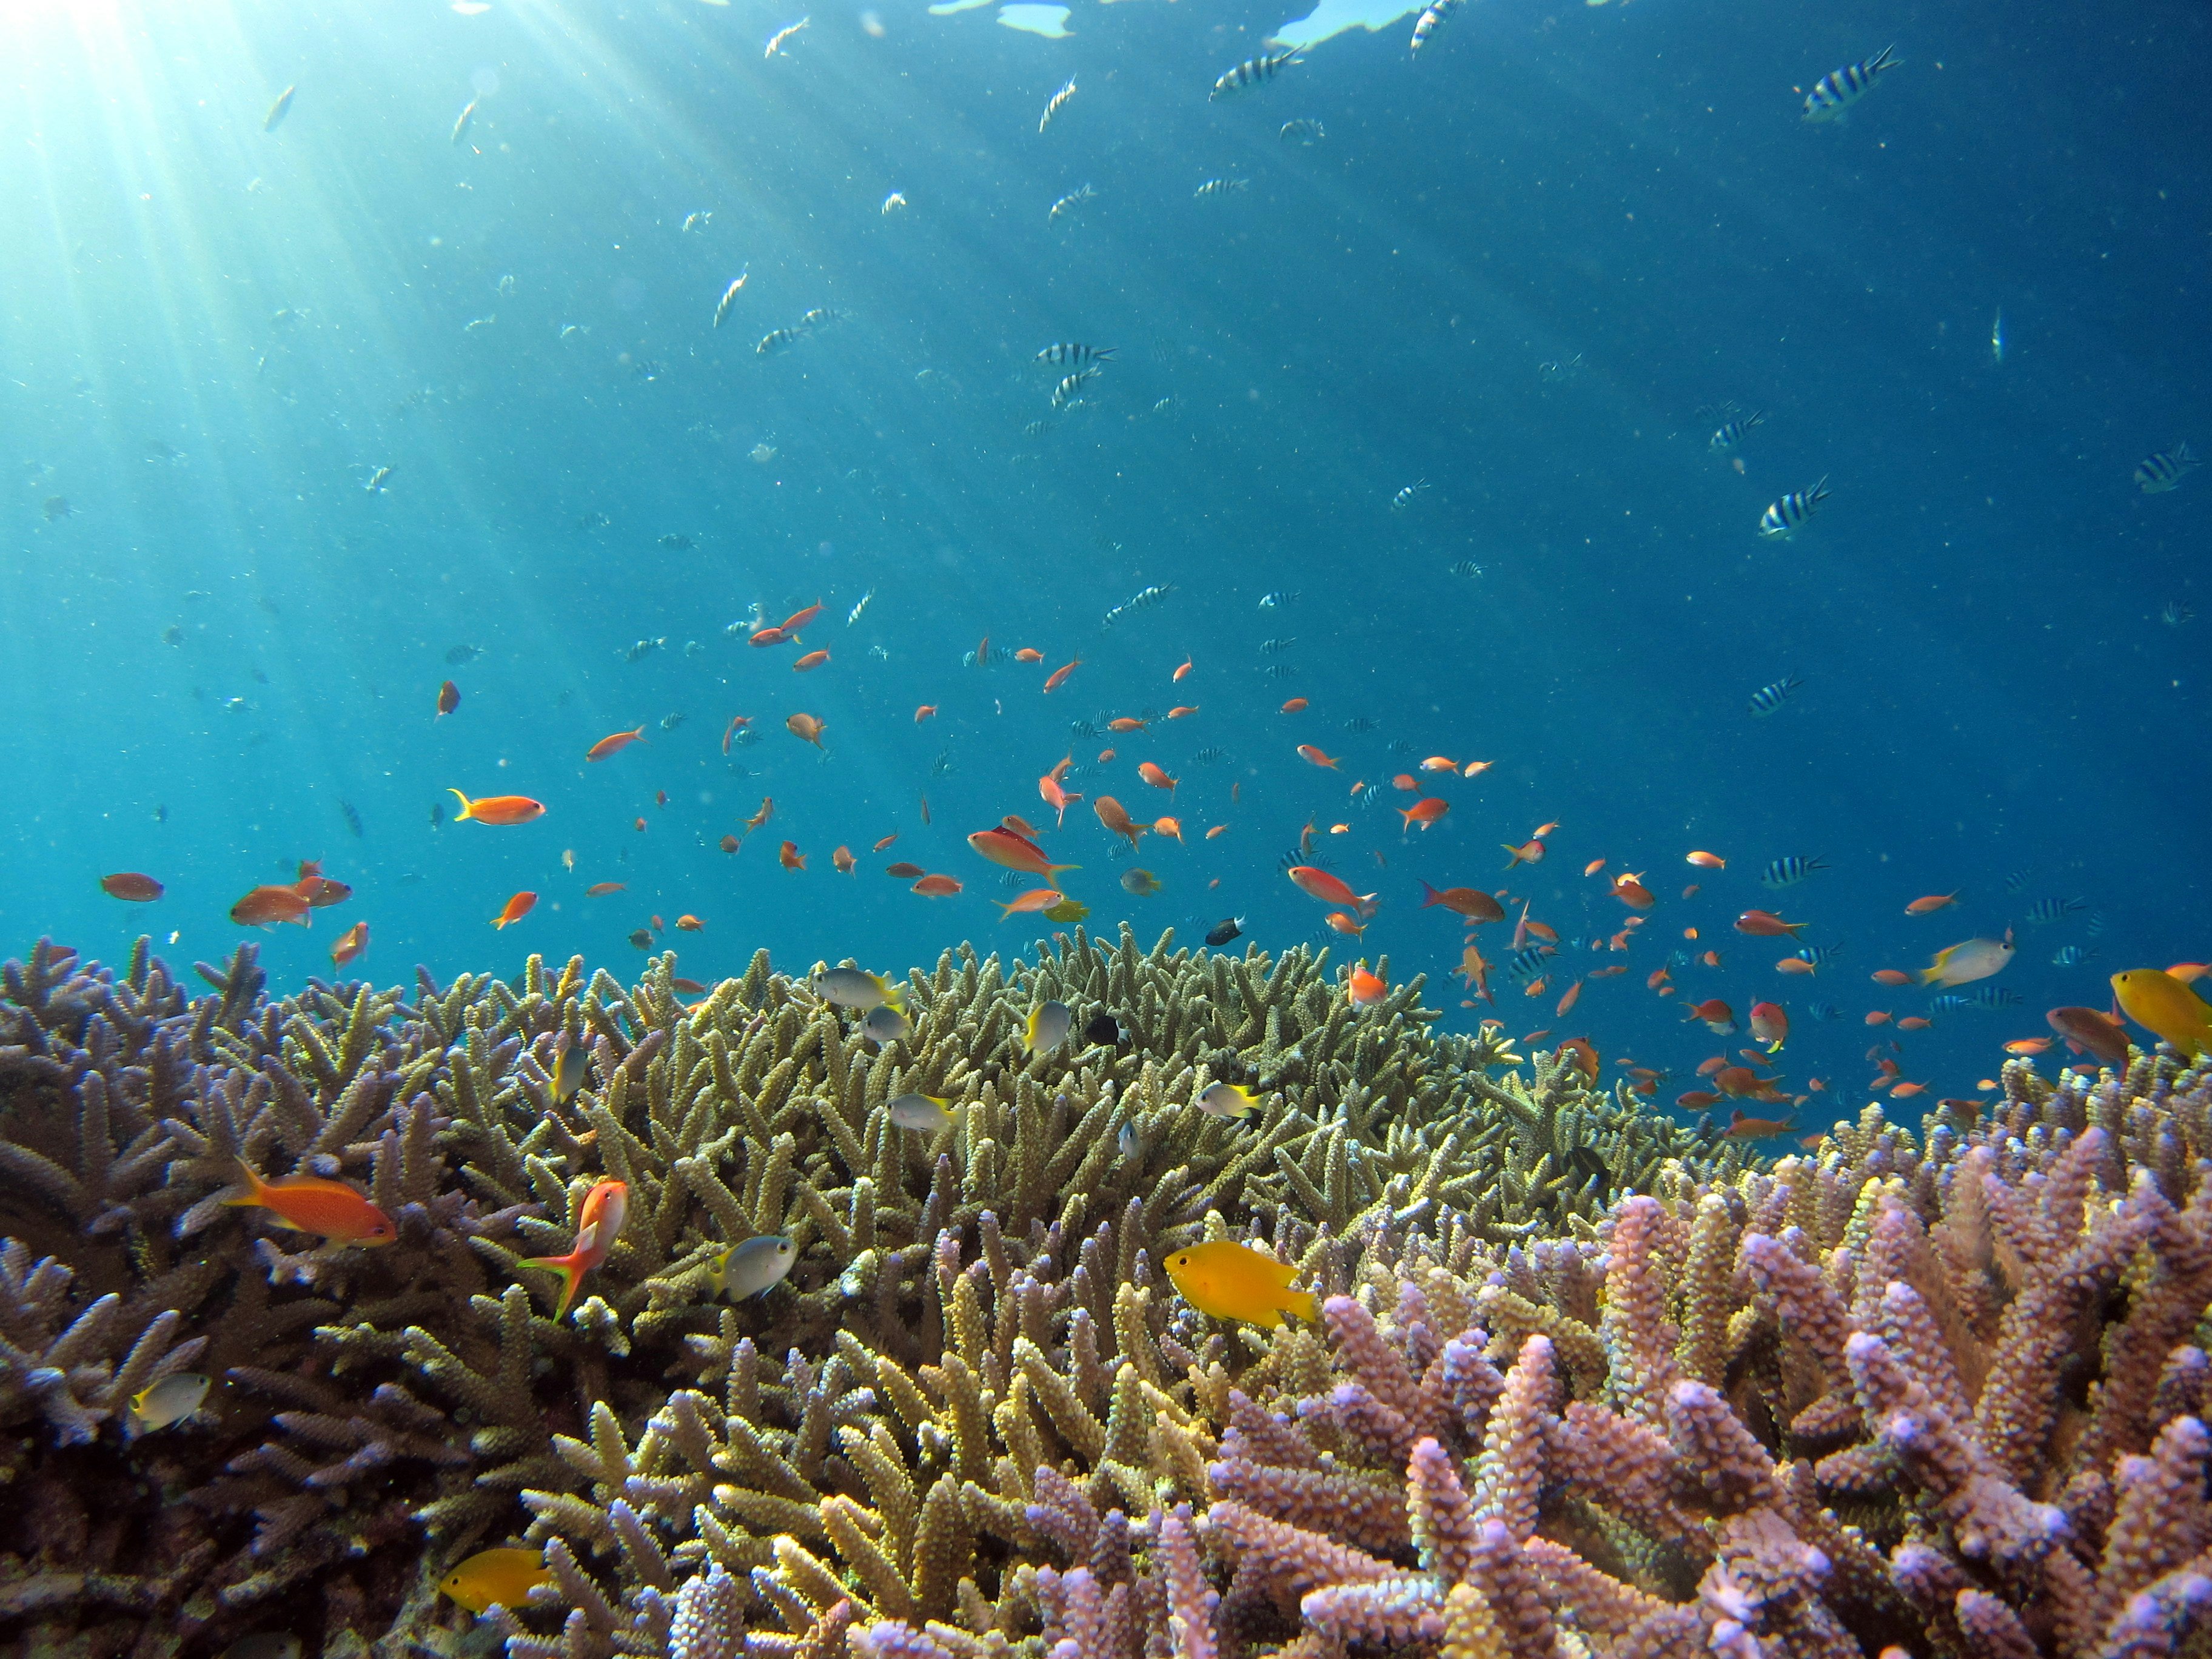
Photomosaic + eDNA reef scores, bleaching risk maps, restoration prioritization for 340 reefs tracked monthly.
Plastics & Pollution Tracking
Drift modeling of microplastics, oil and sargassum. Source attribution to river basins with 500m resolution.
Blue Carbon Verification
MRV for mangroves, saltmarsh and seagrass. Drone LiDAR + soil cores + satellite for audit-grade credits.
Acoustic Intelligence
Whale migration, shipping noise and illegal fishing detection from 120 hydrophones. Real-time alerts to rangers.
Deep-Sea Baseline Surveys
ROV video, mineral mapping and impact assessment for responsible seabed governance before any extraction.
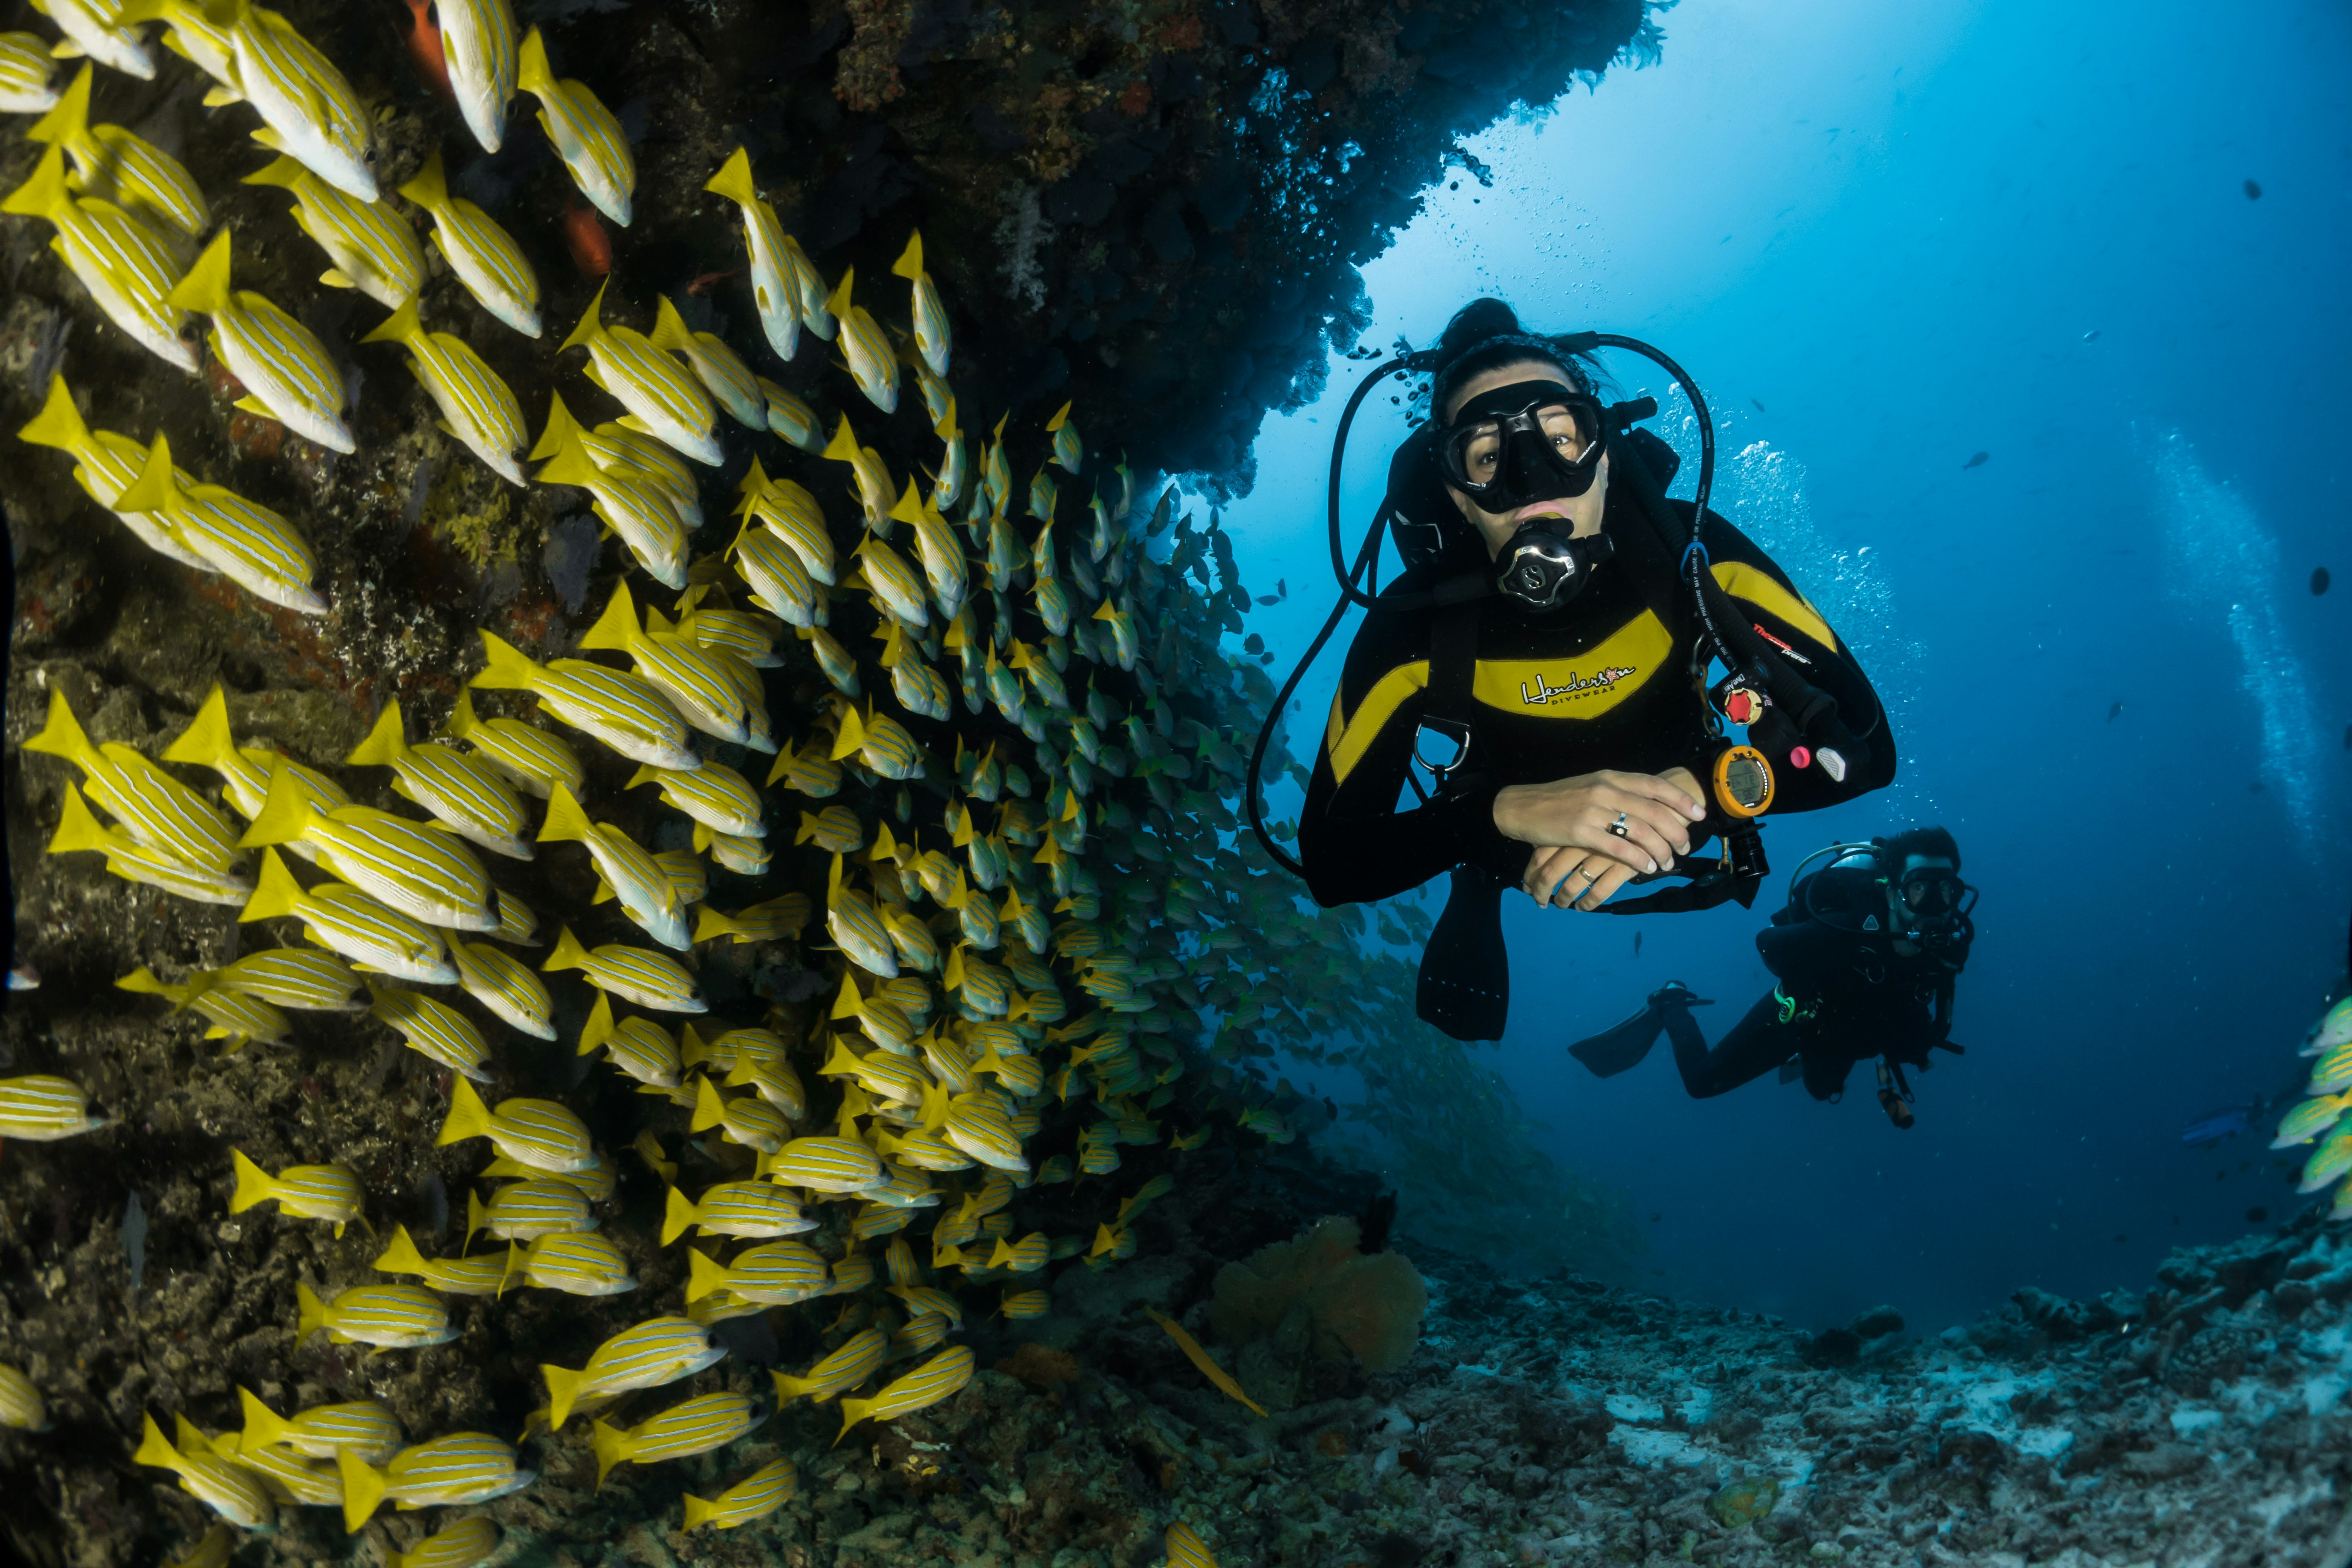
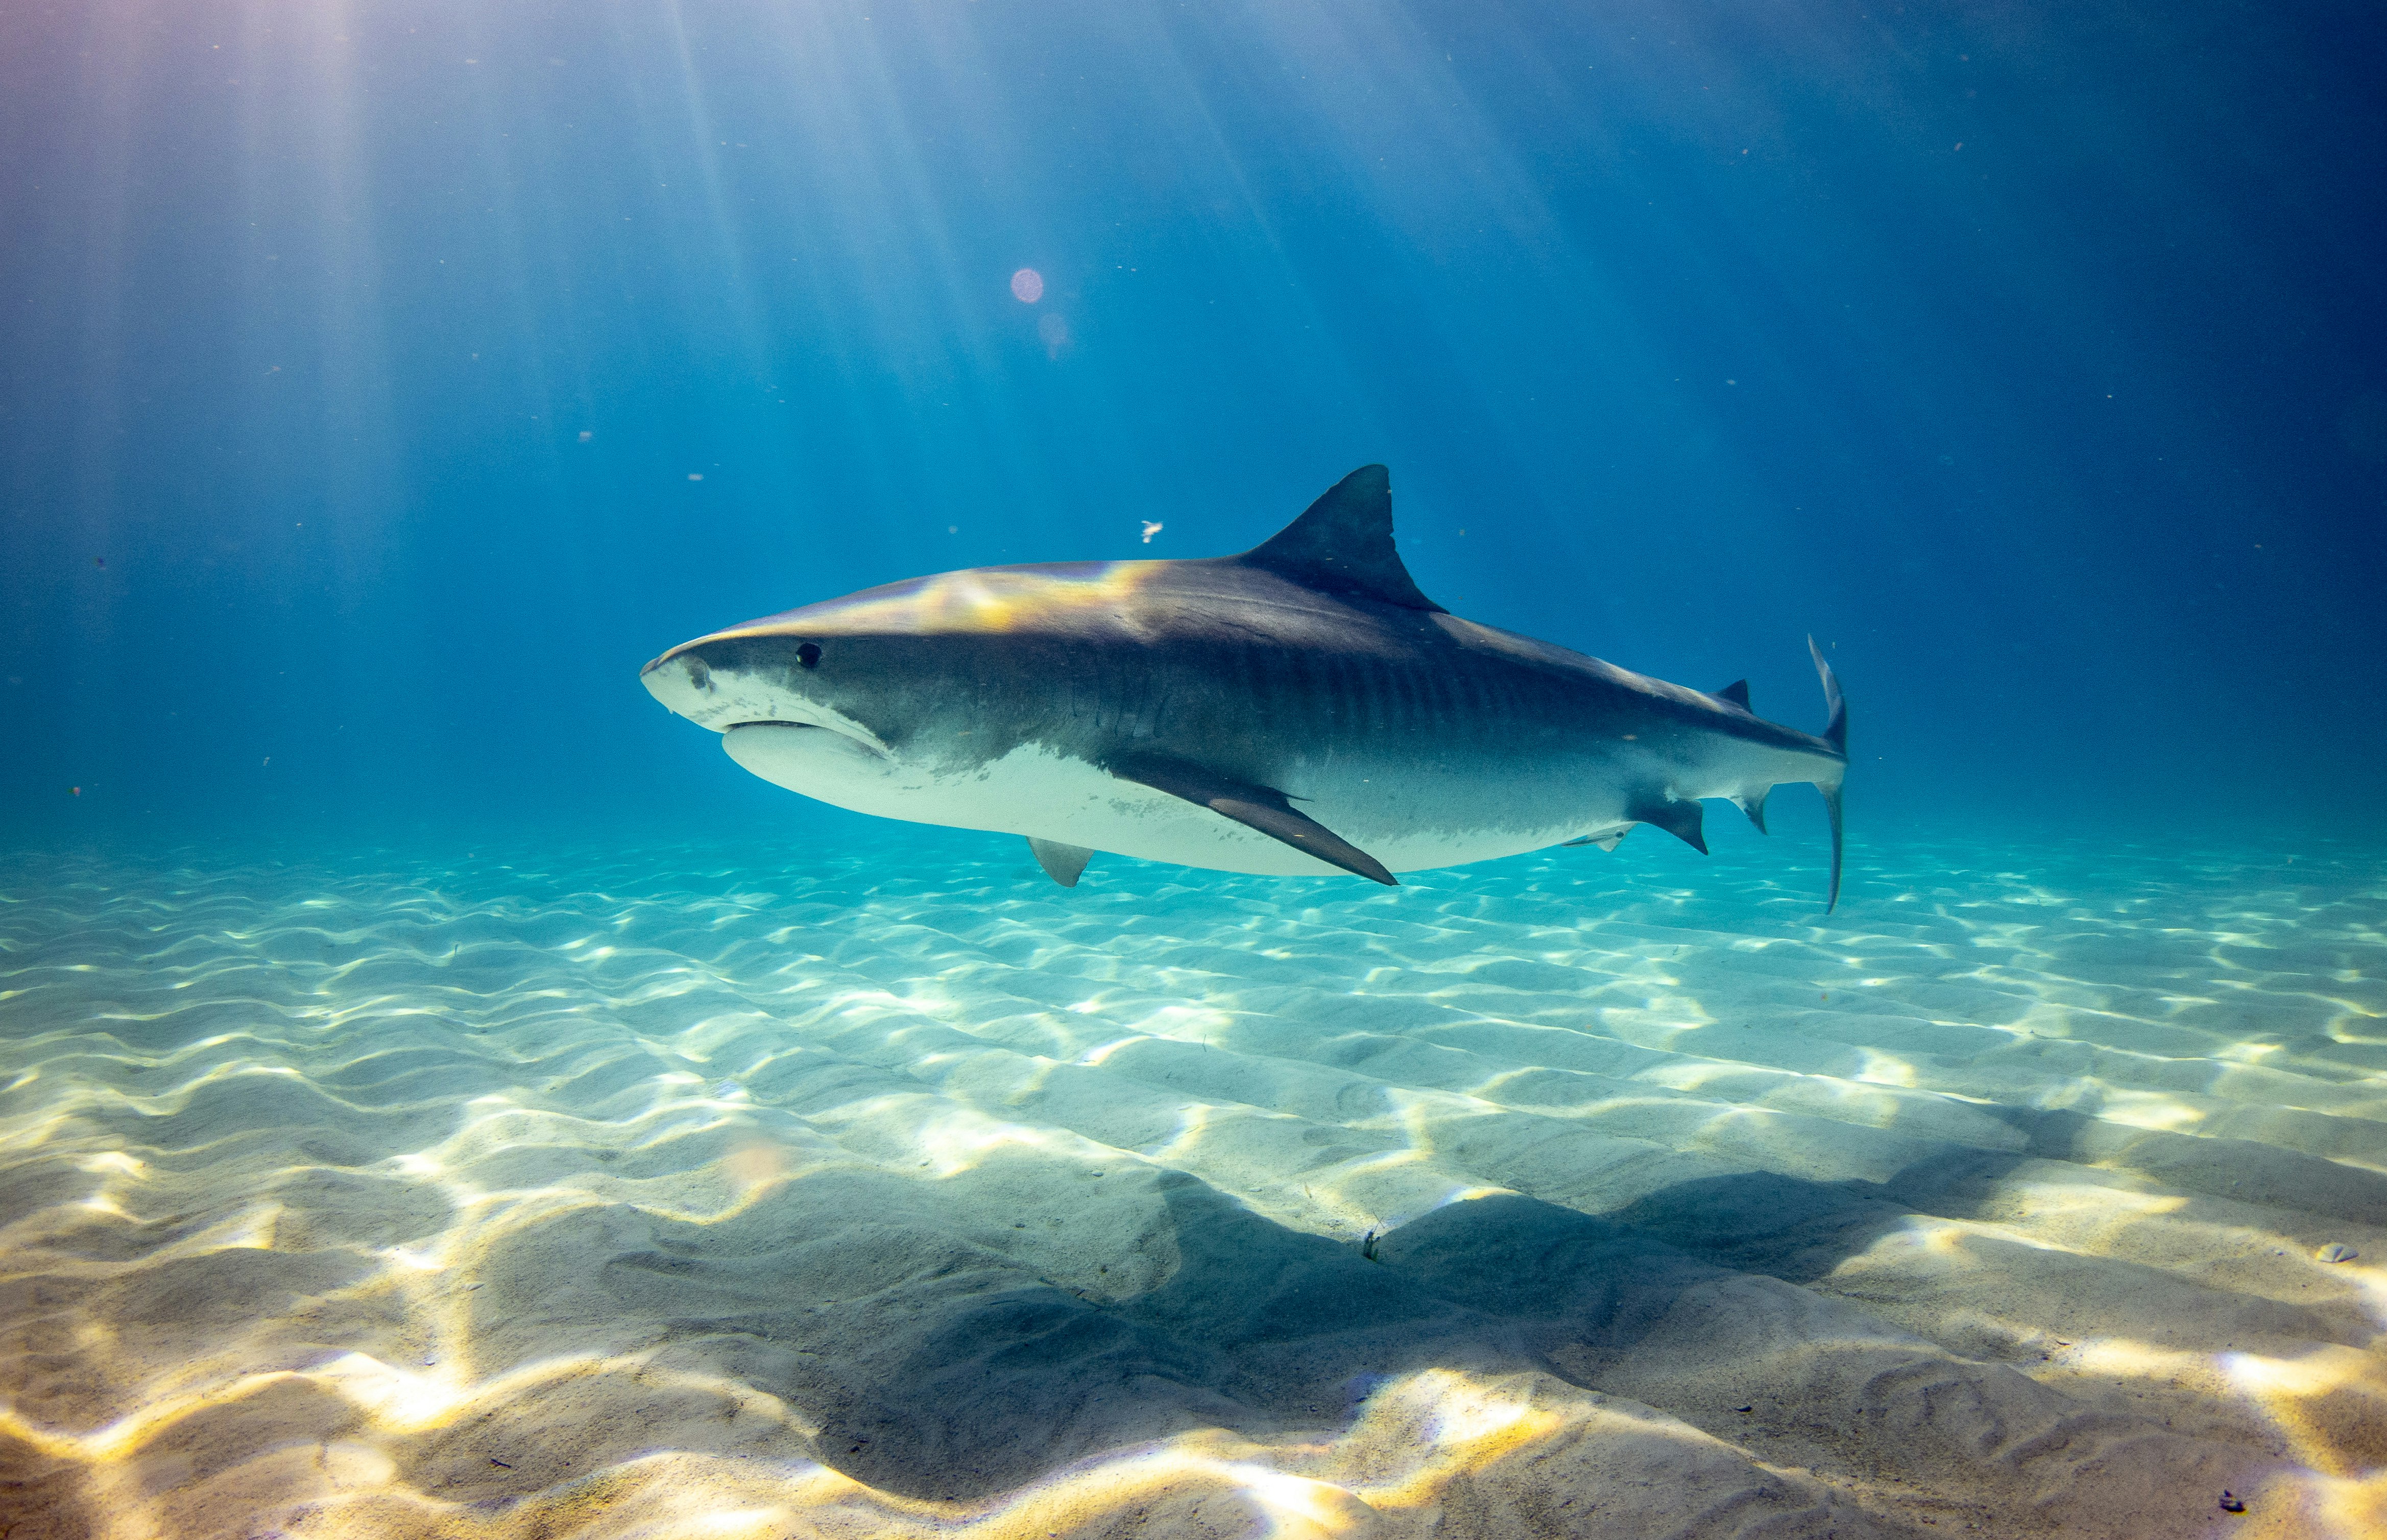
The ocean, quantified every 4 minutes
Abyssal-9 Dashboard
Temperature, oxygen, chlorophyll, pH and noise in one stream. Built for port authorities, aquaculture and marine parks.
6.8 mg/L
▲ stable
1.24 µg/L
bloom watch
8.04
-0.02 vs 1990
92 dB
shipping lane

Degree Heating Weeks 6.2. Advisory sent to 42 MPA managers. Cooling predicted in 9 days.
Subscribe to alertsThree expeditions. One living map.
Arctic Echo — Svalbard
Under-ice gliders + acoustic census of bowheads. Tracking Atlantification and methane seeps. June–Sept 2026.
● 34 DAYS • 18 SCIENTISTS • R/V NORDLYS
Abyssal Frontier — Clarion-Clipperton
4K ROV transects at 4,500m, baseline biodiversity before mining decisions. eDNA + polymetallic nodule mapping.
● 52 DAYS • 26 SCIENTISTS • R/V TETHYS
Reef Reborn — Coral Triangle
Super-reef discovery, heat-resilient coral gardening, community-led monitoring with 120 fishers trained.
● 90 DAYS • 40 SCIENTISTS • 6 ISLAND HUBS
Latest dispatches
Peer-reviewed briefs, expedition logs and data stories. Click any card to open the full analysis.
Expedition reports are being processed in the lab — check back at high tide.
Questions from deck & shore
Is your data open access?
Yes. Raw sensor streams are CC-BY after 48h QC. Forecast APIs have a free research tier; commercial SLA includes 99.9% uptime and audit trails.
How accurate are marine heatwave forecasts?
Abyssal-9 scores 97% precision for 72-hour outlooks and 84% for 14-day outlooks, validated against 4,800 drifting buoys and satellite SST.
Do you support blue carbon projects?
End-to-end MRV: baseline mapping, additionality modeling, drone verification and registry-ready documentation for Verra and Gold Standard pathways.
Can cities use this for coastal resilience?
Absolutely. We deliver flood + erosion + water-quality dashboards for 23 coastal cities, with SMS alerts for fishers and lifeguards.
Put the ocean on your dashboard
Get the weekly Ocean Pulse, expedition invites and early API access. No spam — only signal from the sea.
Trusted by marine parks, ports, aquaculture leaders and 68 research institutes.
Contact bridge
HQ: Pier 9, Ocean Quay
Expedition base: Tromsø • Singapore • Valparaíso
[email protected]
Response within 24h • Mon–Fri